(Mathematical Institute, University of Oxford). Received 22 Feb, 2021.
We live in a connected world where people, goods, information, and diseases travel from one region to the next. In the years of COVID, a particularly dramatic example of this propagation phenomenon is, of course, the transmission of the coronavirus from a single seed location (Wuhan, China), to the rest of the world through an intricate network of local and global travel routes.
The same phenomenon also appears in a much smaller system, the human brain where toxic proteins related to neurodegenerative diseases like Alzheimer’s or Parkinson’s are believed to originate in a single region and are transported to the rest of the brain through the so-called connectome, the network of axonal pathways connecting different regions of the brain [1, 2].
From a mathematical perspective, both phenomena can be understood as the propagation of an autocatalytic process on networks and the main question is to understand its overall dynamics: If a process like a disease starts at a seed location, how long will it take to appear at other locations, and then develop through a full-scale invasion, leading to a global pandemic for a disease or to dementia for the brain?
The simplest model for such invasion process on a network is the discrete equivalent of the celebrated Fisher-KolmogorovPetrovsky-Piskunov reaction-diffusion equation (Fisher-KPP) [3]. If pi = pi(t) is the quantity of interest in a region i evolving with time t, then on a network with N nodes, it takes the simple form of system on N differential equations
![]() (2)
(2)
![]() (3)
(3)
where L is the symmetric graph Laplacian that models diffusion process on a graph and encodes the connection between regions (Lij = 0 if there is no connection between regions i and j and minij{Lij} = −1.
The system is seeded at nodes. Now, consider the particular case when the autocatalytic term is dominant over the diffusion term: ρ/α << 1. An example of a network with 5 nodes is shown in Fig. 1 together with the dynamics of each variable at different nodes.
A number of interesting observations can be made. Early on, the dynamics of the first node evolves on its own, with all other variables negligible. Then, the invasion starts appearing at other nodes, and very soon, the entire system is invaded. The mathematical question is to find the typical half-time of invasion for each node, represented by the value half-way (the time τi when p(τi) = 1/2) and an approximation for each curve.
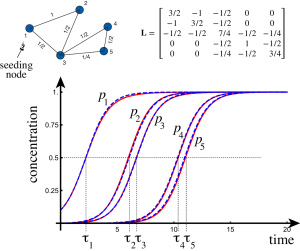
Figure 1: Example of dynamics on a 5-node network. Initially, only the first node
is seeded (p1(0) = 1/10). Due to the coupling term, the second node and then
all other modes are invaded. The numerical solution is shown in red (solid) and
the nonlinear asymptotic solution are in blue (dashed) (α = 1, ρ = 1/100)
There are two ways to approach the problem. The first one is to isolate two nodes and linearise the sub-system for these two nodes. Then it is not too difficult to show that the halftime between two nodes i and j is given
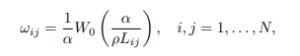 (4)
(4)
where W0 is the Lambert function. This flight time induces naturally a notion of temporal distance on a graph by finding the shortest Lambert temporal distance Ωij between nodes i and j based on the node-node distance. It also leads to reasonable estimate for the halftimes for a seed at node s. The initial τs is given by isolating that single node and solving the nonlinear system to obtain
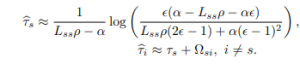 (5)
(5)
The second method is to find an asymptotic expression of each concentration in terms of sigmoid-like function. Then the problem is to consider the nonlinear interactions of these different localized solutions, a problem that leads to a system of transcendental equations for the times τi that can easily be solved numerically by using the approximation τbi as a first guess.
We can now scale up that simple example to the entire brain by considering the connectome provided by averaging axonal pathways on multiple brains and leading to the 1015 node connectome shown in Fig. 2. If we seed this connectome with a toxic protein in the entorhinal cortex, where Alzheimer’s disease is known to originate, we can follow the evolution of the disease through the brain.
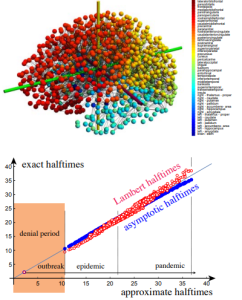
Figure 2: A brain connectome with 1015 nodes (top) and the computation of halftimes for the dynamics (bottom) compared against numerical values (solid blue circles: nonlinear approximation, open red circles: Lambert temporal distance). Note the initial denial period, followed by a massive outbreak, leading to a global pandemic outbreak in the entire brain.
In Fig. 2 we compare the halftimes predicted by the Lambert distance and our nonlinear approximations against the numerical solution and find them both in very good qualitative agreement. A typical feature of the dynamics is an initial delay between the invasion of the first and second node when the disease appears in the posterior cingulate cortex. We call this the denial period, a time where the disease seems to be localised in a single region but is seeded, often below detection, to other region. As soon as the second node is seeded, the propagation turns from local outbreak to a systematic invasion and a global epidemic, not unlike the coronavirus pandemic observed in the first semester of 2021.
This type of analysis paves the way to understand different features of the disease such as the typical and systematic staging patterns known to occur in the brain [4], the role of clearance mechanisms [5], or multiple species of interacting proteins [6, 7]. We have developed open-access software package to study systematically in silico the effect of new drug treatments and understand the basic mechanisms underlying neurodegenerative diseases and dementia. More broadly, as an applied mathematics
problem, these ideas can be applied to many other settings such as disease transmission [8] or the propagation of faults and failure
in electric networks.
References
[1] Formari S., Schäfer A., Goriely A., and E. Kuhl. Prion-like spreading of alzheimer’s disease within the brain’s connectome. Journal of the Royal Society Interface, 16(159):20190356, 2019.
[2] Sveva Fornari, Amelie Schäfer, Ellen Kuhl, and Alain Goriely. Spatiallyextended nucleation-aggregation-fragmentation models for the dynamics of prion-like neurodegenerative protein-spreading in the brain and its connectome. Journal of Theoretical Biology, 486:110102, 2020.
[3] Johannes Weickenmeier, Ellen Kuhl, and Alain Goriely. Multiphysics of Prionlike Diseases: Progression and Atrophy. Physical Review Letters, 121(15):158101, 2018.
[4] Prama Putra, Travis B Thompson, and Alain Goriely. Braiding braak and braak: Staging patterns and model selection in network neurodegeneration. bioRxiv, 2021.
[5] T. Thompson, G. Meisl, and A. Goriely. The role of clearance mechanisms in the kinetic of toxic proteins aggregates involved in neurodegenerative diseases. Preprint, 2020.
[6] Travis B Thompson, Ellen Kuhl, and Alain Goriely. Protein-protein interactions in neurodegenerative diseases: a conspiracy theory. BioRxiv, (doi), 2020.
[7] PG Kevrekidis, Travis B Thompson, and Alain Goriely. Anisotropic diffusion and traveling waves of toxic proteins in neurodegenerative diseases. Physics Letters A, 384(36):126935, 2020.
[8] Kevin Linka, Proton Rahman, Alain Goriely, and Ellen Kuhl. Is it safe to lift covid-19 travel bans? the newfoundland story. Comp. Mech., 2020.